Algorithm
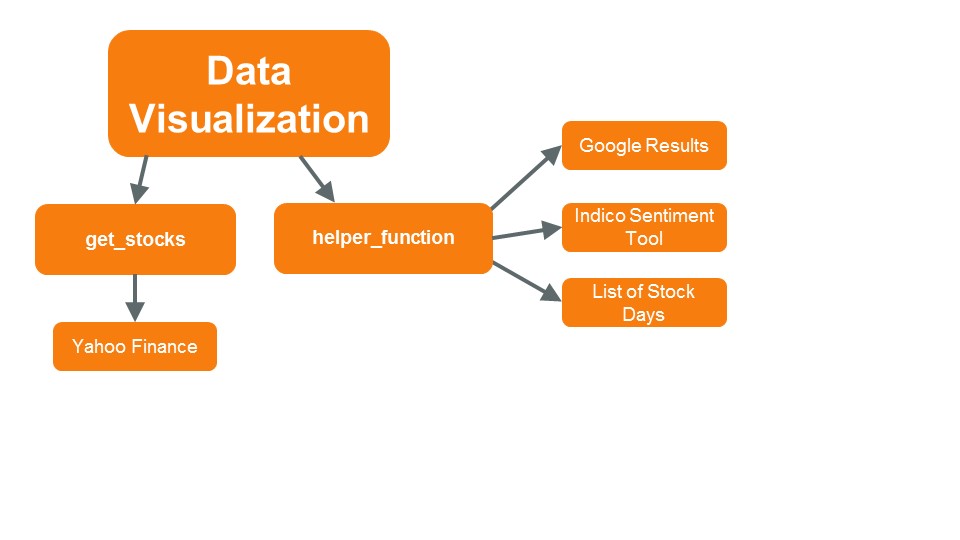
This program obtains stock data for a company for every day the stock market is open through the get_stocks() function. Public opinion values are obtained by running Selenium Webdriver to crawl Google searches, using Indico’s sentiment processor to analyze the first page of google news results (for the given day and company), and outputing an average public opinion value for that day. The data visualization component of the project uses Plotly’s python graphing library to plot an interactive graph overlaying the stock data with the sentiment results. It is executed in one function that calls get_stocks() and get_sentiments() to obtain the data that is plotted. This function takes the company name, start date, and end date as inputs and is the main function that a user would interact with.
